AWS Measuring Agents
How to launch AWS based Measuring Agents
Thank you for using the RealLoad product.
This User Guide gives you an overview of how to use RealLoad and also contains numerous links to relevant details.
The order of the chapters in this guide corresponds to the order of the menus in the Main Navigation Bar.

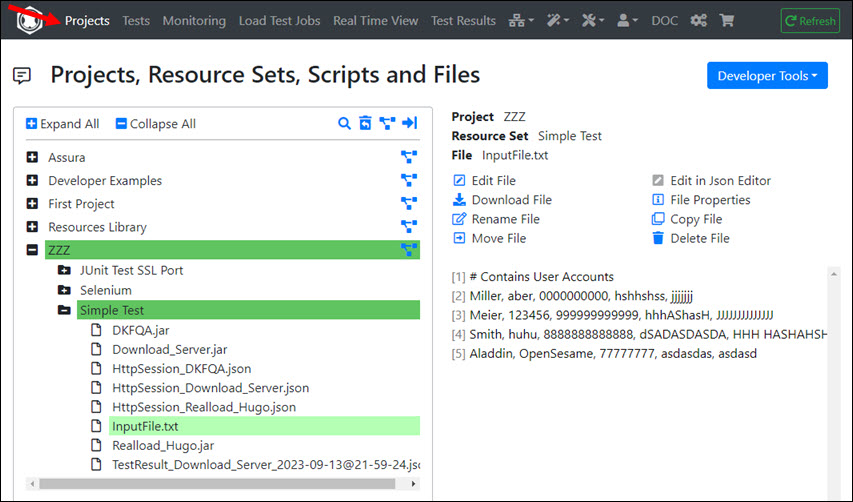
After you have signed in to the RealLoad Portal, you will see a Main Navigation Bar whose first menu on the left is Projects. This is a file browser that displays all of your files. The view is divided into Projects and Resource Sets which contain all the files for executing your tests and the test results of the executed load tests. You can also store additional files in a Resource Set which contain e.g. instructions on how a test should be performed.
Among other things, you can:
There is also a recycle bin from which you can restore deleted projects, resource sets and files.
In the Developer Tools dropdown menu, there is a wizard that supports converting a Selenium IDE Test to a RealLoad Test, and an example of developing a JUnit Test from scratch.
The Test Menu shows all tests that you have defined. You can also filter the view according to Projects and Resource Sets, and sort the tests in different ways.
Tests can defined:
…and can be executed:
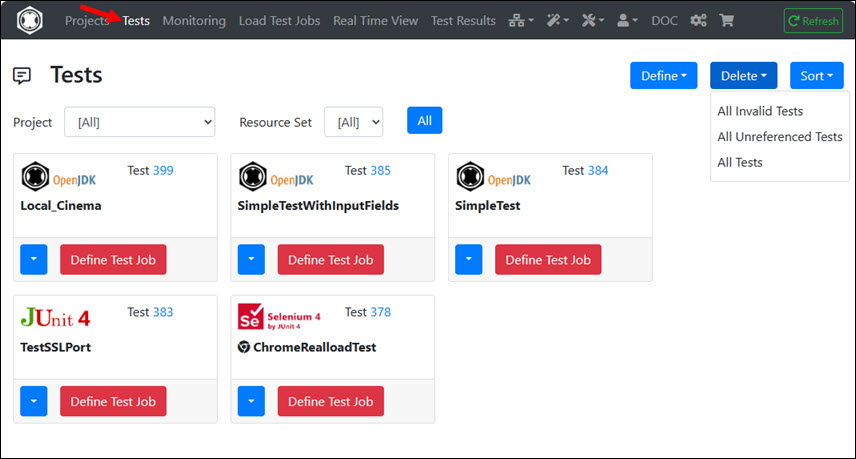
Note that a test is something like a bracket that only contains references to the files that are required for the test execution. There a no files stored inside the test itself.
Each test has a base location from which it was defined (Project + Resource Set) and to where also the load test results are saved.
A test itself can reference its resource files in two ways:
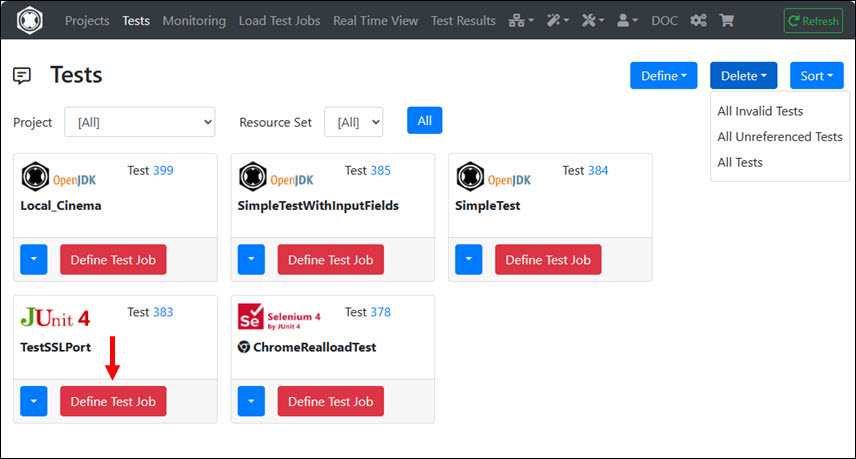
After you have clicked on a test on “Define Test Job”, the intermediate “Define Test Job” menu is displayed.
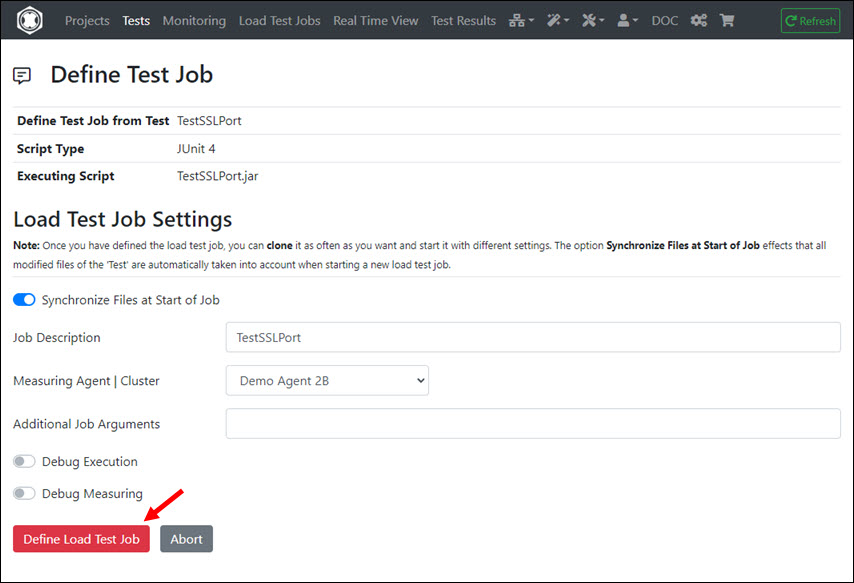
In contrast to a “test”, all referenced files of the test are copied into the “load test job”. For this reason there is also the option “Synchronize Files at Start of Job” which you should always have switched on. At “Additional Job Arguments” you can enter test-specific command line arguments that are transferred directly to the test program or test script. However, you usually do not need to enter anything.
After you have clicked on “Define Load Test Job” the test job is created and the view changes from the “Tests” menu to the Load Test Jobs menu.
This menu is documented at Synthetic Monitoring.
In this menu all load test jobs are displayed with their states. The green point at the top right next to the title indicates that all measurement agents and cluster controllers which are set to ‘active’ can also be reached. The color of the point changes to yellow or red if one or more ‘active’ measuring agents and cluster controllers cannot be reached / are not available.
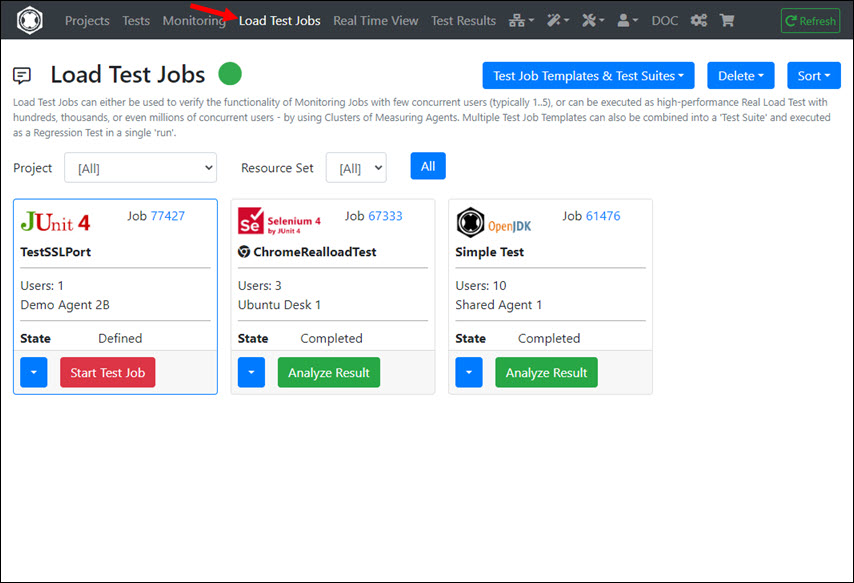
A load test job can have one of the following state:
As soon as a job is in the “defined” state, it has a “local job Id”. If the job is then submitted to a measuring agent or cluster controller, the job has additionally a “remote job Id”.
From this menu you can also create Test Job Templates and edit Test Suites - which can be executed as Regression Tests.
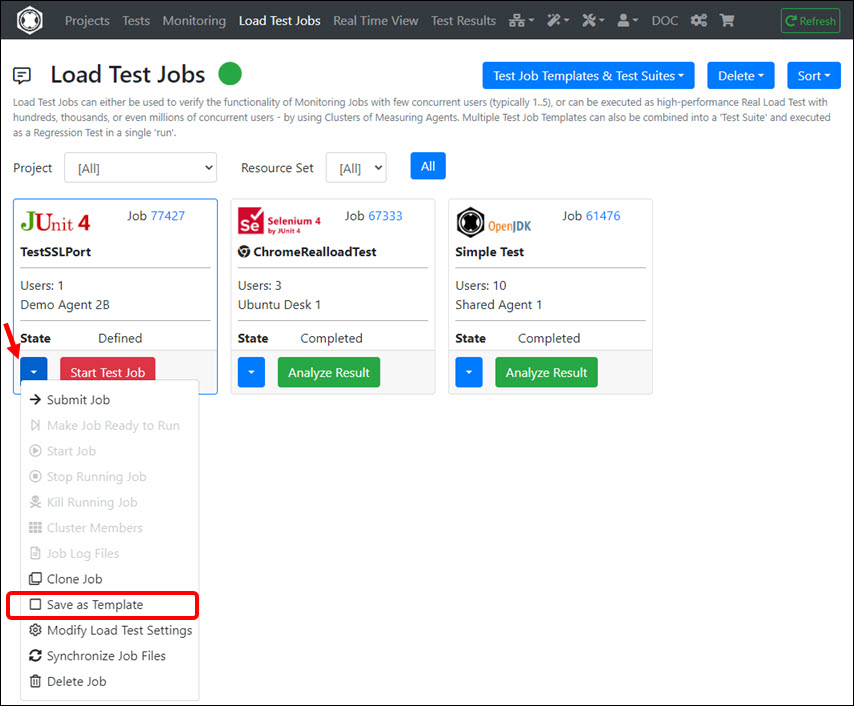
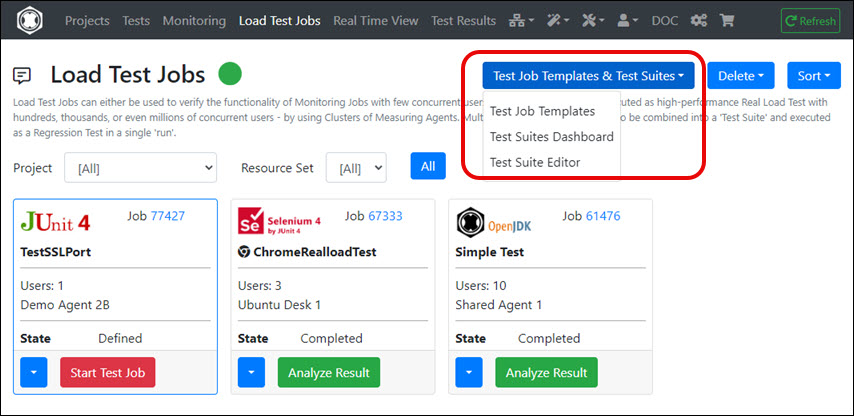
After you have clicked on “Start Test Job” in a load test job you can select/modify the Measuring Agent or Cluster of Measuring Agents on which the job will be executed, and you can configure the job settings.
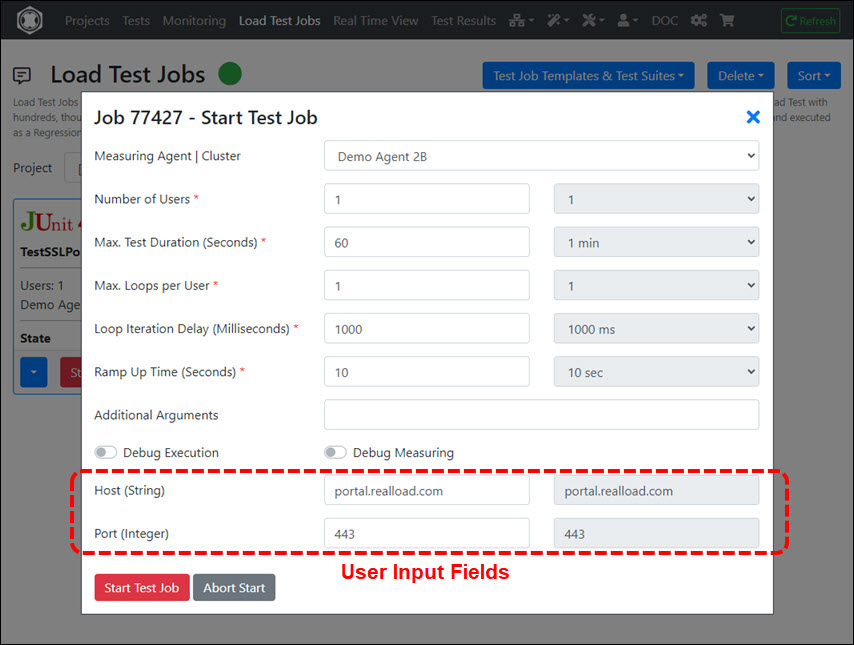
Input Fields:
Normally you do not have to enter any “Additional Arguments” and leave “Debug Execution” and “Debug Measuring” switched off.
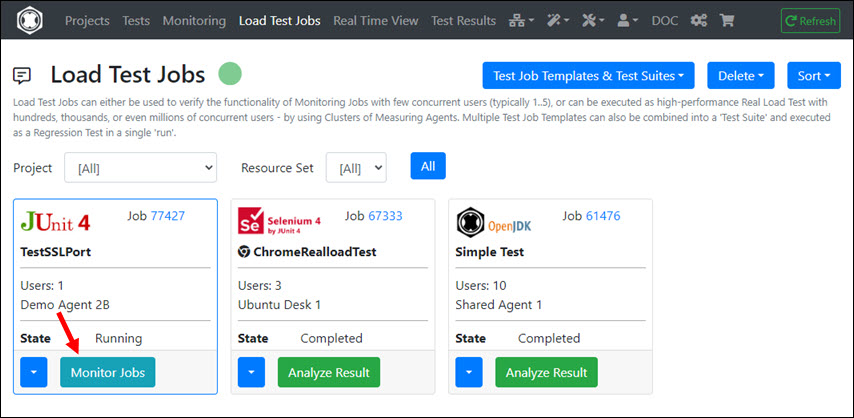
After clicking Start Test Job, the job is started on the Measuring Agent or Custer of Measuring Agents and is then in the state “Running”. Then click on “Monitor Jobs” and the view changes from the “Load Test Jobs” menu to the Real Time View menu.
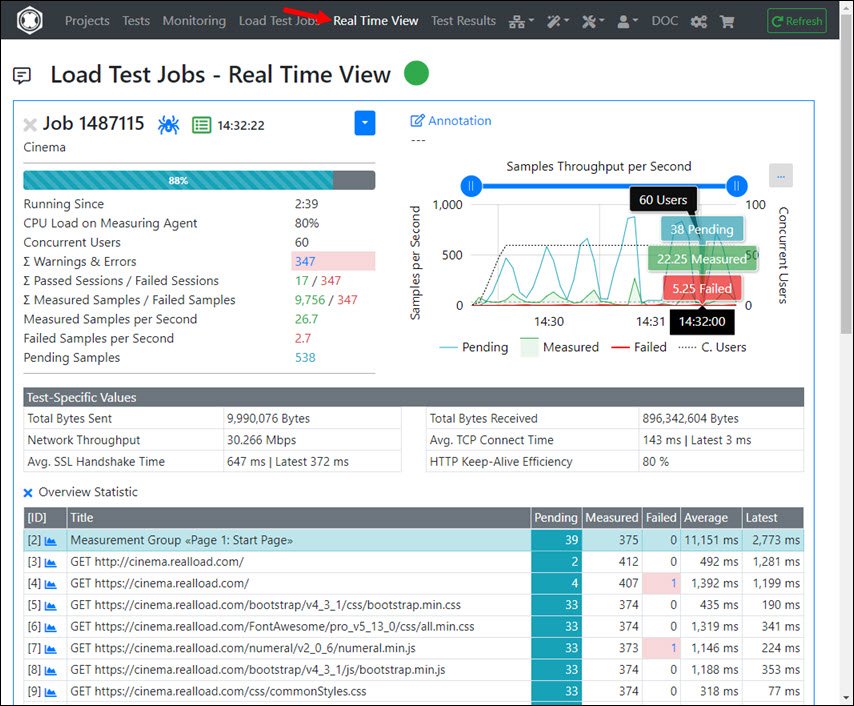
The real time view shows all currently running load test jobs including their measured values and errors.
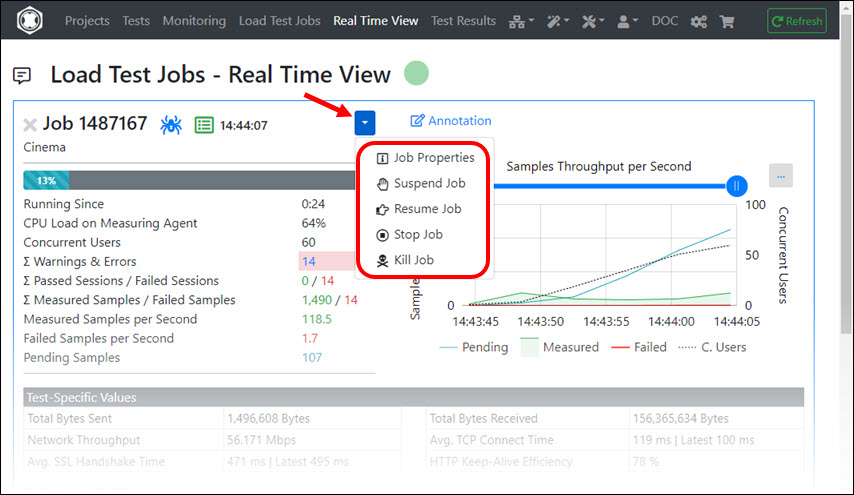
You can also suspend a running job for a while and resume it later. However this has no effect on the “Max. Test Duration”.
After the job is completed you can click on “Analyze Result”. The view changes then to the Test Results menu.
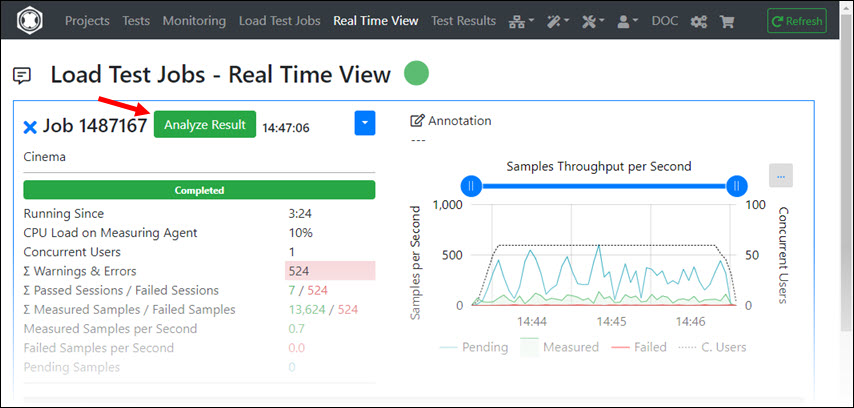
If you click on “Analyze Result”, the test result is also copied into the Project / Resource Set from which the test was defined. From there you can reload the test result into the Test Results menu at any time.
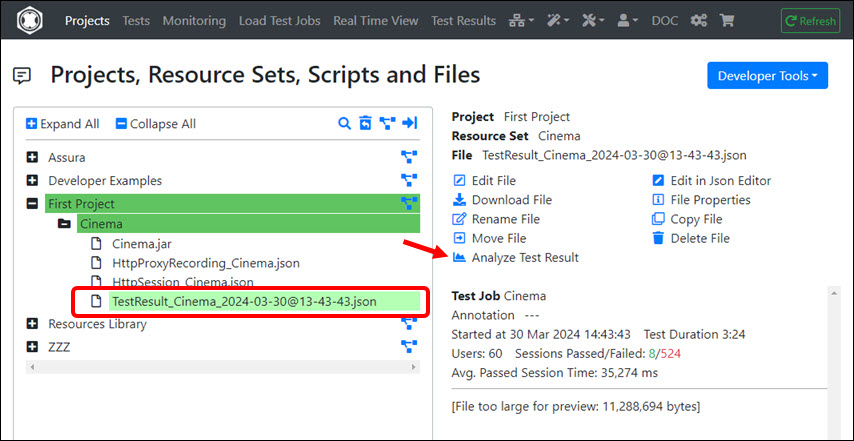
The “Test Results” menu is a workspace into which you can load multiple test results from any type of test. You can also switch back and forth between the test results. All measured values and all measured errors are displayed. In addition, Percentile Statistics and Diagrams of Error Types are also displayed in this menu.
This menu enables you also to combine several test results into a so-called Load Curve - to determine the maximum number of users that a system such a Web server can handle (see next chapter).
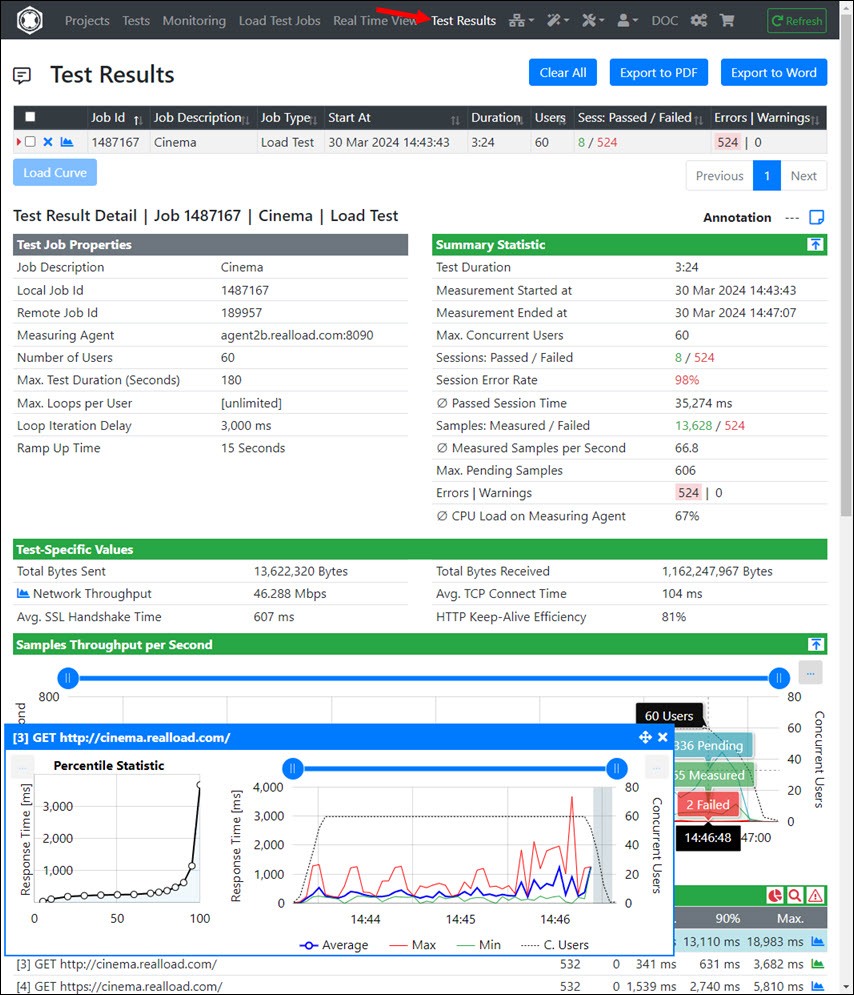
The Summary Statistic of a test result contains some interesting values:
Since several thousand to several million response times can be measured in a very short time during a test, the successfully measured response times are summarized in the response time diagrams at 4-second intervals. For this reason, a minimum value, a average value and a maximum value is displayed for each 4-second interval in such diagrams.
However, this summarization is not performed for Percentile Statistics and for Measured Errors. Every single measured value is taken into account here.
The maximum capacity of a system, such as the maximum number of users that a web server can handle, can be determined by a so-called Load Curve.
To obtain such a Load Curve, you must repeat the same load test several times, by increasing the number of users with each test. For example a test series with 10, 50, 100, 200, 400, 800, 1200 and 1600 users.
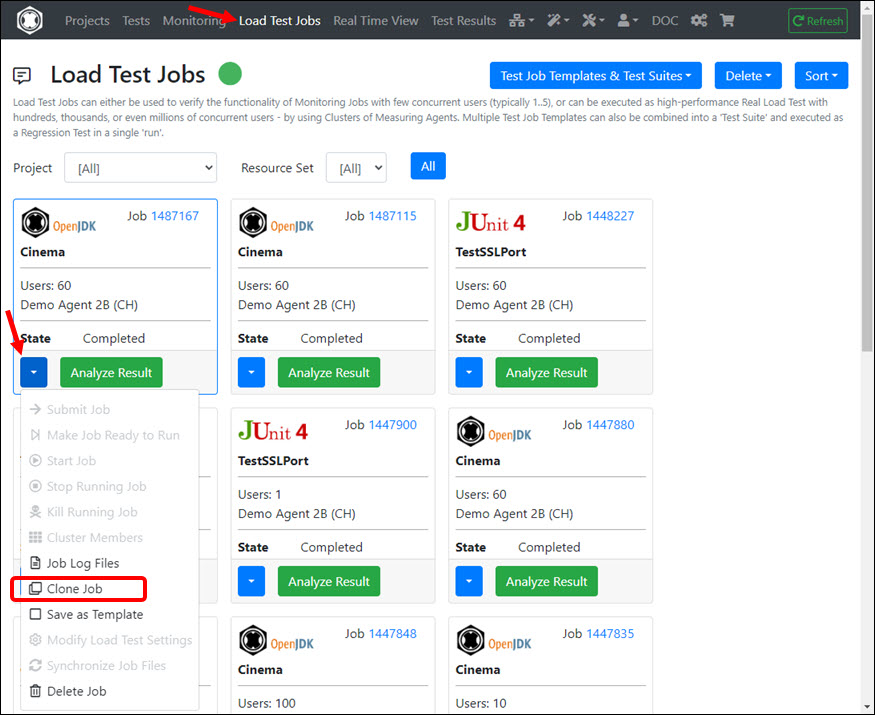
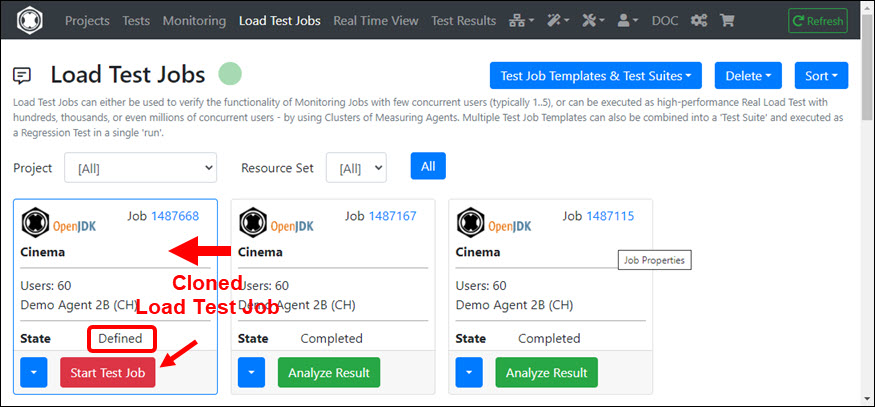
The easiest way to repeat a test is to Clone a Load Test Job. You can then enter a higher number of users when starting the cloned load test job.
A measured Load Curve looks like this, for example:
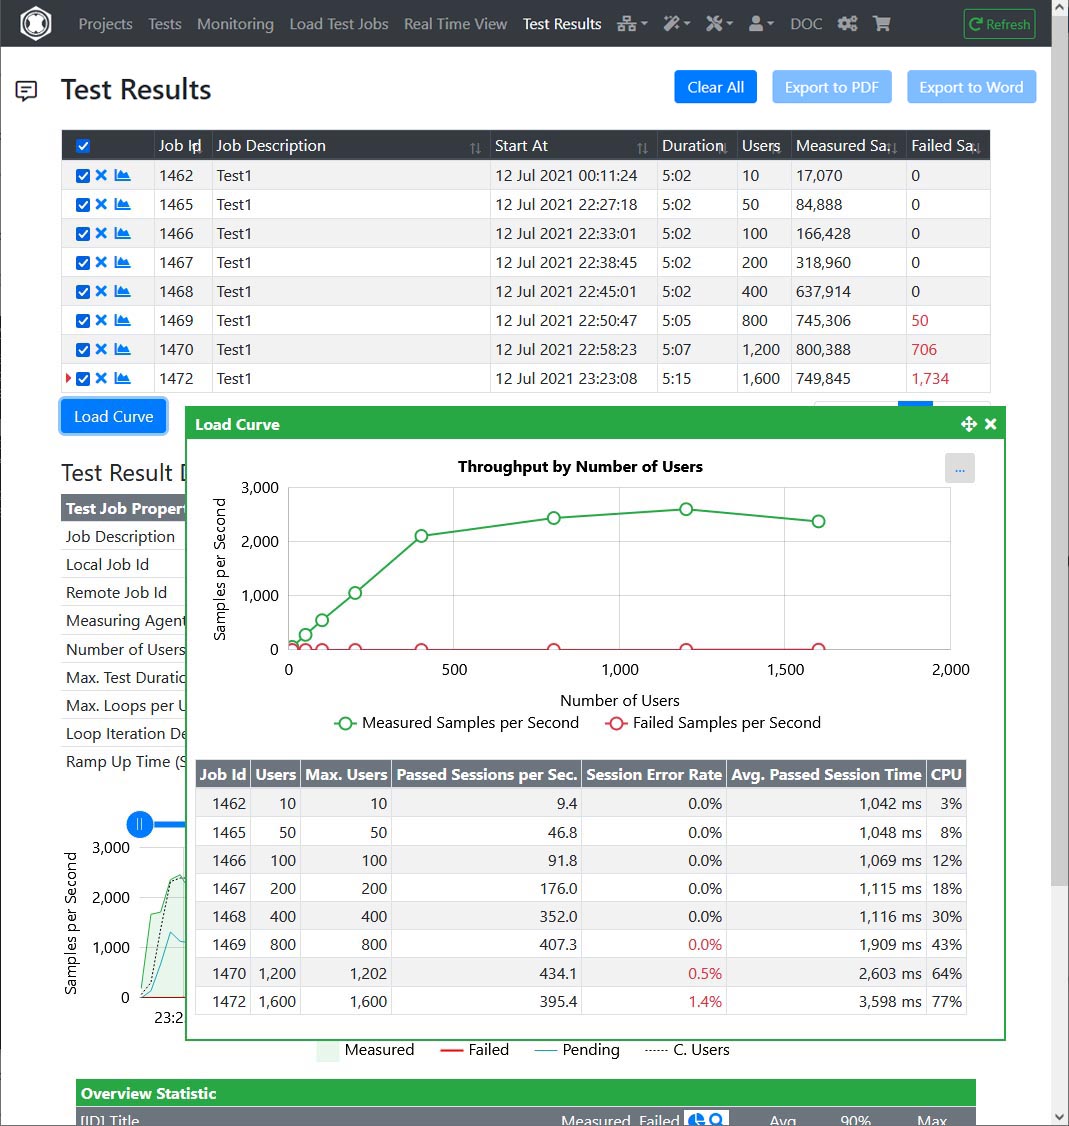
As you can see, the throughput of the server increases linearly up to 400 users - with the response times remaining more or less the same (Avg. Passed Session Time). Then, with 800, 1200 and 1600 users, only individual errors are measured at first, then also many errors, with the response times now increasing sharply.
This means that the server can serve up to 400 users without any problems.
But could you operate the server with 800 users if you accept longer response times? With 800 users, 745,306 URL calls were successfully measured, with only 50 errors occurring.
To find it out, let’s compare the detailed response times of “Page 1” of 400 users with 800 users.
Response Times of “Page 1” at 400 Users:

Response Times of “Page 1” at 800 Users:

The 95% percentile value at 400 users is 224 milliseconds and increases to 1952 milliseconds at 800 users. Now you could say that it just takes longer. However, if you look at the red curve of the outliers, these are only one time a little bit more than 1 second at 400 users, but often more than 8 seconds at 800 users. Conclusion: The server cannot be operated with 800 users because it is then overloaded.
Now let’s do one last test with 600 users. Result:
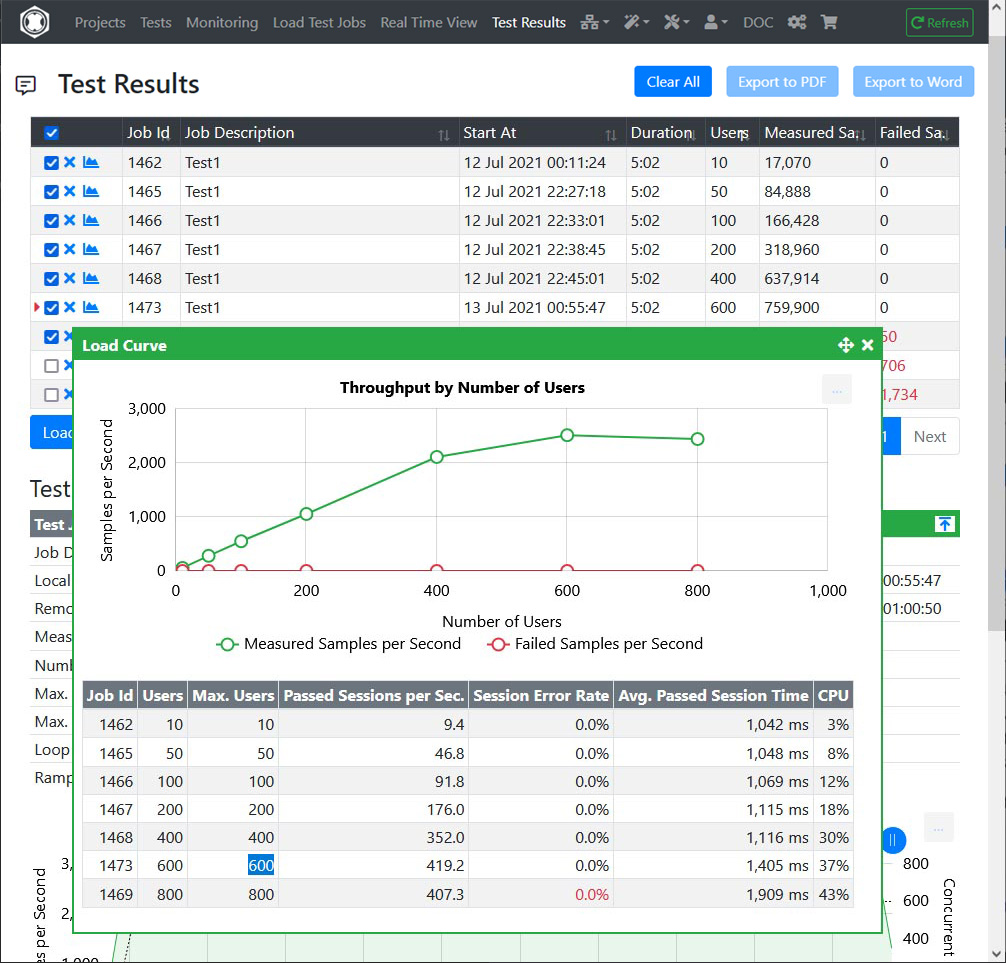
The throughput of the server at 600 users is a little bit higher than at 400 users and also little bit higher than at 800 users. No errors were measured.
Response Times of “Page 1” at 600 Users:

The 95% percentile value at 600 users is 650 milliseconds, and there are only two outliers with a little bit more than one second.
Final Conclusion: The server can serve up to 600 Users, but no more.
In rare cases it can happen that a test does not measure anything (neither measurement results nor errors). In this case you should either wait until the test is finished or stop it directly in the “Real Time View” menu.
Then you can then acquire the test log files in the “Load Test Jobs” menu and search for errors.
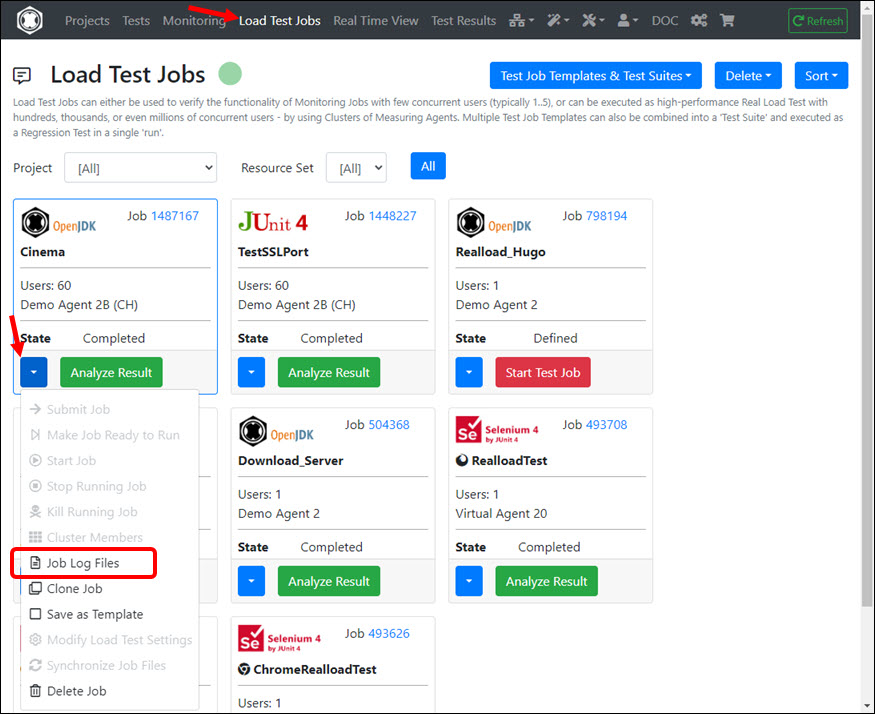
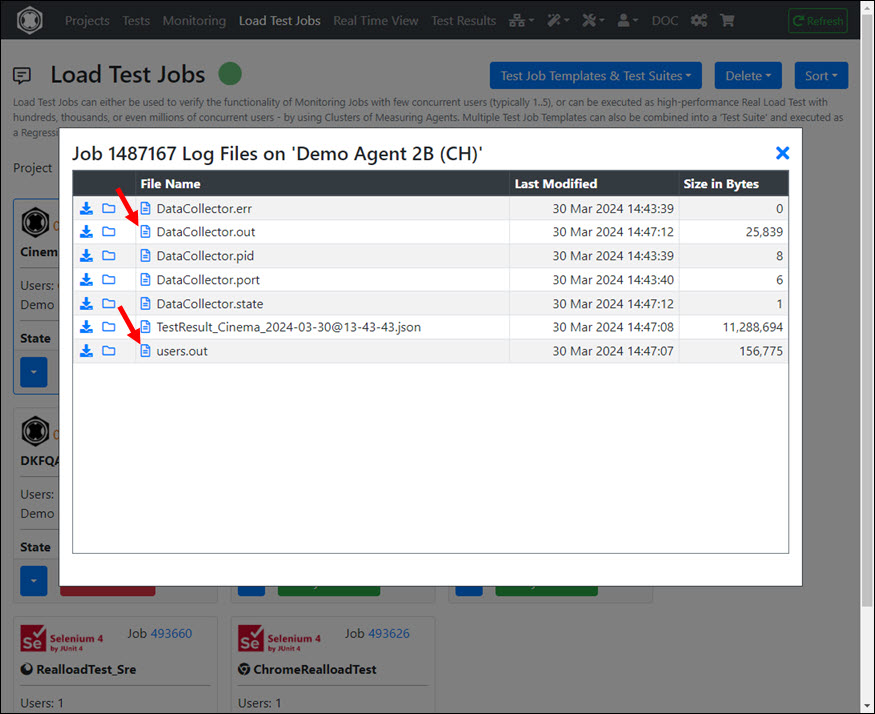
If your test has problems when extracting and assigning variable values, you should also search the log files for error messages. To get detailed information you can run the test once again - but this time with the option “Debug Execution” enabled.
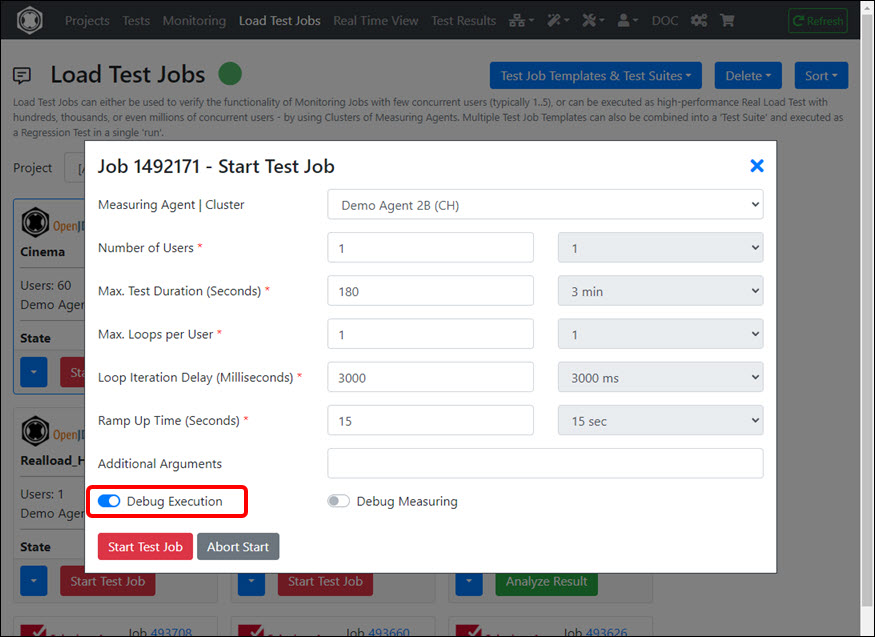
Don’t forget to turn off the “Debug Execution” option after the problem has been solved.
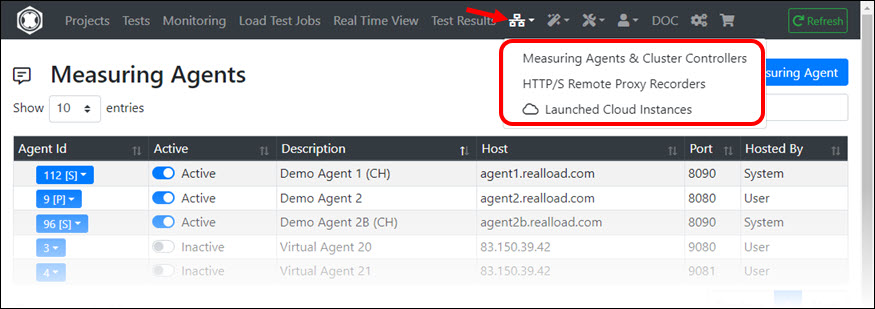
The Network Components menu allows you to manage Measuring Agents, Cluster Controllers and HTTP/S Remote Proxy Recorders. In addition, you can also start additional components that you only need for a short time as AWS Cloud Instances by spending RealLoad Cloud Credits.
On the one hand, depending on your license (Price Plan), you can add and manage Measuring Agents and Cluster Controllers that you operate yourself. On the other hand, you can also launch additional Measuring Agents and Cluster Controllers using RealLoad Cloud Credits.
How to launch and operate Measuring Agents and Cluster Controllers using your own AWS account is documented at AWS Measuring Agents.
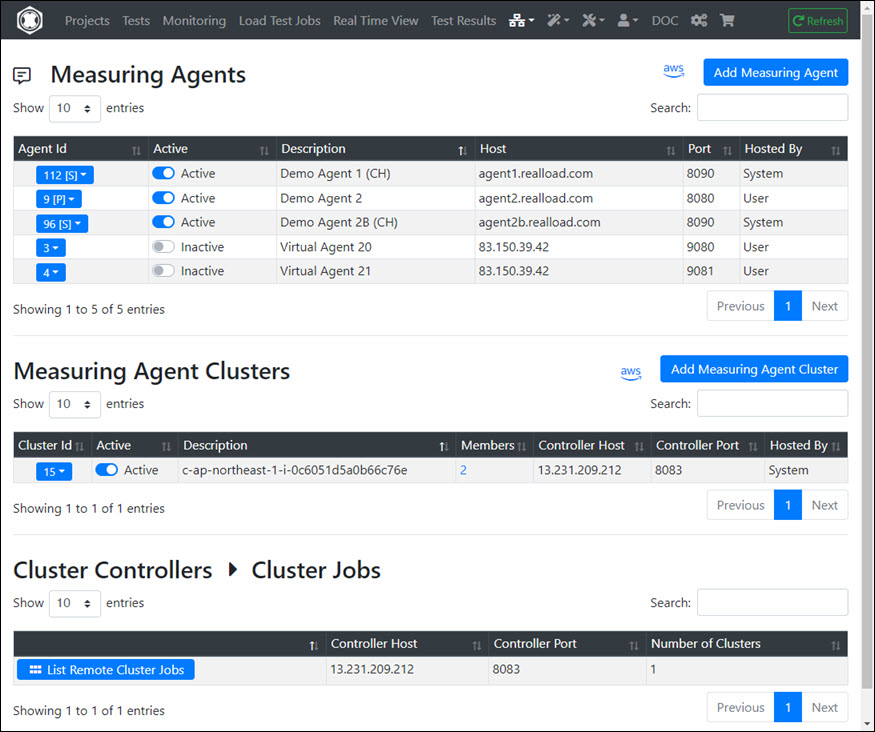

HTTP/S Remote Proxy Recorders can be used to record Web Surfing Sessions, which can then be post-processed with the HTTP Test Wizard and converted into a RealLoad Test.
The most important points here are:
The complete documentation is available at HTTP/S Remote Proxy Recorder.
This menu shows (only) all AWS instances that were launched using RealLoad Cloud Credits. Here you can also terminate such instances early - whereby Cloud Credits for complete unused hours are refunded.
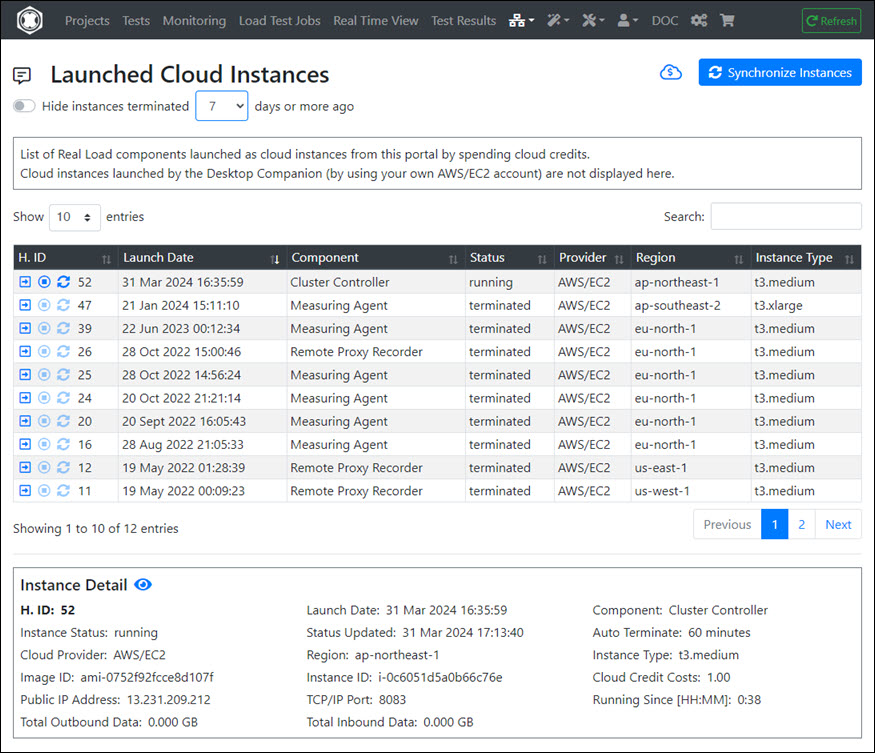
This menu only displays the wizards that can be accessed via direct navigation. In addition, the RealLoad product contains numerous other wizards that are accessible depending on the context.

The functionalities of the HTTP Test Wizard (+ Plug-Ins and Published Plug-Ins) is documented at HTTP Test Wizard.
“User Input Fields” are additional values that are entered when starting or defining a test execution and that are available as (global) variables during test execution.
With this wizard you can create or edit JSON files containing definitions of User Input Fields. By convention, the names of such files must always start with ‘InputFields_’ and end with ‘.json’.
A User Input Field contains the following attributes:
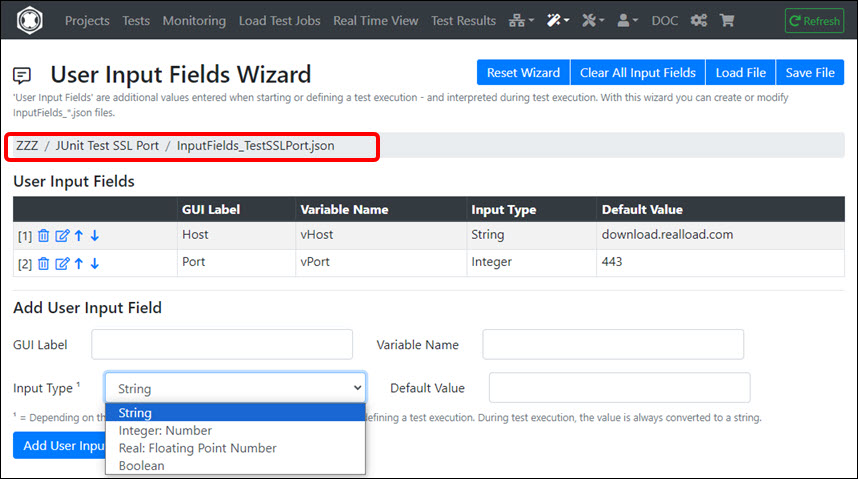
User Input Fields are supported by All Types of RealLoad Tests.
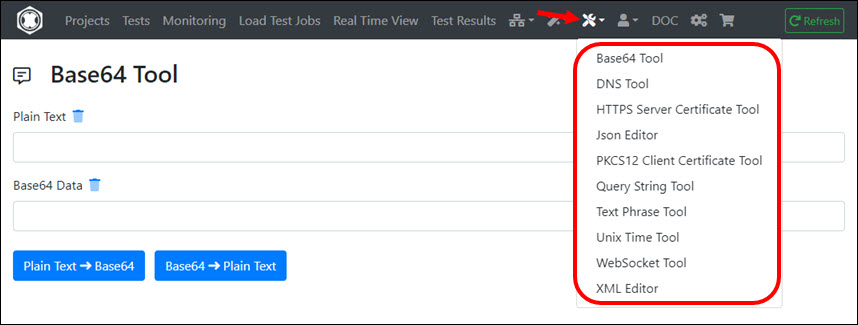
This menu contains tools that are helpful for developing and debugging tests:
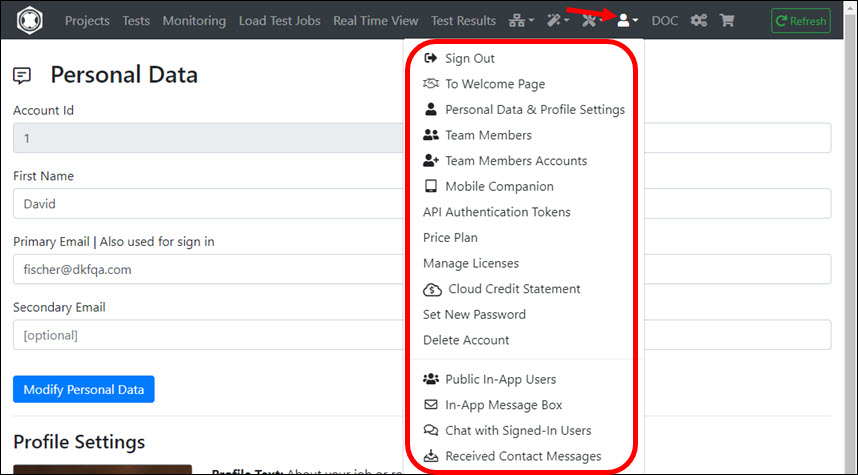
Submenus:
The following submenus are only accessible depending on your configured “Personal Data & Profile Settings”:

Clicking this icon will open a new browser window or tab to download.realload.com

Clicking this icon will open a new browser window or tab to shop.realload.com
Here you can Purchase Licenses and additional Cloud Credits.
If you have any questions, please email us at support@realload.com
How to launch AWS based Measuring Agents
Recording and Post-Processing of a Web Surfing Session
User Guide | HTTP Test Wizard
User Guide | HTTP/S Remote Proxy Recorder